How to Read Prediction Market Prices
A prediction market price looks simple. A contract trades at 66¢. The screen shows 66%. The temptation is to call that a forecast.
It is not that simple.
A price is a market signal formed by orders, liquidity, timing and rules. It can approximate a probability. It can also hide a wide spread, a thin order book, or a settlement detail that changes the question.
This guide builds a clean reading process. It uses a live Kalshi market on the September 2026 Federal Reserve decision. The snapshot was captured on 12 August 2026. It is a worked example, not a rate prediction.
What a prediction market price means
Most event contracts pay a fixed amount if an outcome occurs. They pay zero if it does not. A Yes contract priced at 66¢ therefore implies roughly a 66% market-implied probability.
That translation is useful, but it needs careful wording. It describes the price that traders currently accept. It does not prove the event has a 66% chance. It does not guarantee a payout.
Kalshi’s probability guide makes the distinction clear. Contract prices reflect collective belief. They are dynamic snapshots. Fees, spreads, liquidity, risk preferences and new information can move the price away from a clean probability estimate.
Think of the number as a compressed market view. Then unpack the market view before acting on it.
Yes, No and Maybe in one minute
In a binary market, Yes means the named event happens. No means it does not. A Yes contract priced at 66¢ suggests about 66%. A No contract on the same event suggests the complement, before costs and market frictions.
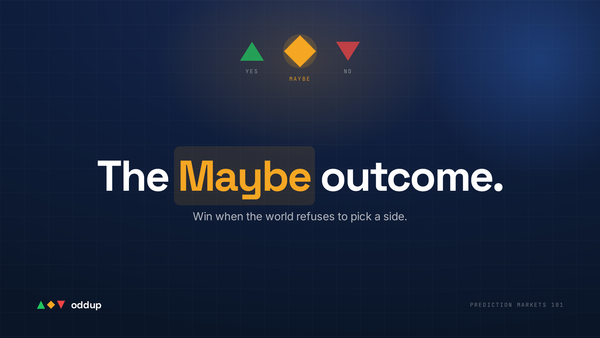
Oddup adds Maybe as a defined third outcome. Yes and No split the remaining 90% of the pool reserve. Maybe receives 10% of the pool reserve.
That is a pool-allocation rule. It is not a guaranteed return for every Maybe position. The market’s written resolution rules still decide the outcome.
Maybe helps when the evidence does not support a clean binary view. It also helps when the market question contains a meaningful middle state. A third outcome should clarify uncertainty, not disguise a vague question.
The four numbers behind a displayed price
Before reading any percentage, find four numbers:
- Bid: the highest price currently offered by a buyer.
- Ask: the lowest price currently offered by a seller.
- Last trade: the price of the most recent completed transaction.
- Displayed price: the number the platform chooses to show.
The displayed price may not be the price you can trade.
Polymarket’s order-book documentation gives a useful example. With a 34¢ bid and a 40¢ ask, the displayed midpoint is 37¢. A buyer pays 40¢ at the ask. A seller receives 34¢ at the bid.
The spread is six cents. That is six percentage points of execution difference on a one-dollar contract. For a small trade, it may be tolerable. For repeated entries and exits, it becomes a central part of the result.
Kalshi and Polymarket use different market structures. The reading habit still transfers. Separate the screen price from the executable price.
Worked example: the September Fed decision
Kalshi’s active September 2026 Fed event contains mutually exclusive rate-decision buckets. Its market data lists a 0-basis-point hike, a 25-basis-point hike, larger hikes, and cuts.
The official Federal Reserve calendar schedules the September FOMC meeting for 15–16 September 2026. Kalshi’s event data shows a market close at 17:59 UTC on 16 September. It expects expiration around 18:05 UTC.
Those timestamps matter. The question is not “What will rates do someday?” It is “Which defined bucket matches the Federal Reserve decision under the market rules?”
Step one: read the market state
In the 12 August API snapshot, the Fed-maintains-rate contract showed a 65¢ bid and a 67¢ ask. Its last trade was 67¢.
The midpoint between the bid and ask was 66¢. That gives a simple market-implied reading of about 66%.
The buyer-facing reading was different. A trader buying immediately paid 67¢, before fees. A trader selling immediately received 65¢, before fees.
The same market therefore carried three useful numbers:
- about 66% at the midpoint;
- about 67% for an immediate buy;
- about 65% for an immediate sale.
The Kalshi market snapshot also listed 3,020,694.09 contracts of volume and 2,418,308.85 contracts of open interest for that bucket. Those figures describe activity and outstanding contracts. They do not guarantee that every size can trade at 66¢ or 67¢.
Step two: compare the adjacent bucket
The 25-basis-point hike contract showed a 33¢ bid and a 34¢ ask. Its last trade was 33¢. The midpoint was 33.5¢.
That produces an approximate market-implied reading of 33.5%. An immediate buyer faced 34¢. An immediate seller faced 33¢.
The contract’s volume was 1,475,688.43. Its open interest was 990,669.05. Again, activity does not equal depth at every price.
Comparing the two buckets teaches a basic lesson. A 66¢ price for maintaining rates does not mean a trader can buy unlimited exposure at 66¢. A 33.5¢ midpoint for a 25-basis-point hike does not mean the market offers a frictionless 33.5% trade.
It also shows why mutually exclusive markets need rule checks. The two outcomes cannot both resolve Yes. A larger hike or a cut can move the settlement into another bucket.
Step three: read the tail outcomes
The same snapshot showed the 25-basis-point cut contract at a 1¢ bid and 2¢ ask. The last trade was 2¢. Its volume was 1,491,223.29 contracts.
A 1.5¢ midpoint suggests a small market-implied probability. It does not mean the event is impossible. It also does not mean the contract is automatically attractive.
At a 2¢ ask, the buyer pays for a small chance and a large gross payout if correct. That gross asymmetry can attract attention. Fees, liquidity, timing and the settlement rule still matter.
Cheap is not the same as good value. Expensive is not the same as safe.
Step four: read the clock
The market closes before the scheduled decision is fully processed. The event data lists a close at 17:59 UTC. Expected expiration follows at about 18:05 UTC.
A trader should ask what happens during that six-minute window. Does the market resolve from an official announcement? Does it wait for a published statement? Can a dispute delay settlement?
The market rules are part of the trade. They are not legal decoration.
Kalshi’s API record names the Federal Reserve as the series settlement source. It also states that only one bucket can resolve Yes. A canceled scheduled meeting receives a specific rule treatment. These details limit ambiguity.
Step five: translate the example to Maybe
Suppose the evidence supports a hold, but the path remains uncertain. Recent data, public commentary and market positioning may point in different directions. The binary choice is still available. The trader can choose Yes or No based on a defined thesis.
On Oddup, Maybe provides a third route when the market design supports it. Maybe receives 10% of the pool reserve. Yes and No split the other 90%.
Maybe is not a claim that the Fed will produce a middle rate. It is a separate market outcome. Its exact meaning must appear in the market rules.
Why displayed probabilities move
Prices move when traders update orders. New data can change one side’s willingness to buy or sell. A large order can consume several price levels. A thin market can move sharply on modest activity.
That movement does not automatically mean the underlying probability changed by the same amount. It may reflect execution pressure, hedging, fees or a temporary liquidity gap.
Read a move through three lenses:
- Information: Did a verifiable fact change?
- Positioning: Did traders rebalance around the news?
- Execution: Did the spread or depth change?
Only the first lens concerns the event itself. The other two concern the market around the event. All three can affect the displayed price.
A beginner’s checklist before choosing an outcome
Use this sequence before you read a contract as a probability:
- Write the exact event in one sentence.
- Find the primary settlement source.
- Record the close time and expected settlement time.
- Read the bid, ask and last trade.
- Calculate the midpoint only when it represents the platform’s display rule.
- Check volume, open interest and available depth.
- List the outcomes that can resolve Yes.
- Check dispute, cancellation and amended-rule language.
- Separate your event thesis from your execution price.
- Use Maybe only when its written definition fits the uncertainty.
This checklist does not tell you which outcome to choose. It tells you what the price is actually saying.
Why this matters for prediction traders
Prediction markets compress uncertainty into a number. That makes them readable. It can also make them look more precise than they are.
A disciplined trader reads the market in layers. Start with the event. Then read the source. Then check the clock. Then inspect the order book. Finally, interpret the displayed probability.
The worked example shows why the process matters. A 66¢ midpoint can sit between a 65¢ bid and a 67¢ ask. A 33.5¢ midpoint can require 34¢ to buy. A 2¢ tail contract can carry real execution and settlement risk.
Price is information. It is not certainty.
Oddup’s three-outcome design adds a practical hedge when a binary frame is too narrow. Yes, No and Maybe work best when each outcome has a precise definition and a transparent settlement path.
Compliance disclaimer
This article is for educational purposes only. It is not financial, investment, trading, legal or tax advice. Prediction markets and digital assets involve risk, including loss of capital, fees, liquidity risk, counterparty risk and settlement risk. Verify live prices and market rules before participating. Oddup does not guarantee outcomes or returns. The Maybe outcome is a structural pool-reserve allocation, not a guaranteed return.